The CARBONO Project: Long-term landscape-scale monitoring of tropical rain forest productivity and dynamics
David B. Clark and Deborah A. Clark
(August 2012)
The CARBONO Project (“carbono” means carbon in Spanish) was launched in 1996 by Deborah A. Clark, David B. Clark, and Steven F. Oberbauer at the La Selva Reseach Station. From its inception, the project has focused on how tropical rainforest productivity and dynamics are affected by interannual climatic variation and long-term climatic and atmospheric changes. The project was explicitly conceived to serve as a cross-disciplinary research magnet, such that collaborators in many disciplines could build on the core long-term field data-series and the unique landscape-scale plot network. The success of this idea can be seen in the diversity of topics covered in the 100+ publications from this project to date.
History
Two key and novel ideas motivated the project’s design. First was a focus on landscape-scale phenomena. Our interest was the performance of old-growth tropical rainforest across the within-landscape gradients of topography and soil nutrients. Such a perspective cannot be addressed with a single forest inventory plot, the typical research design at tropical forest field sites. A second innovation was our focus on forest performance at annual and sub-annual timescales. Climate is seasonal everywhere, including in the wet tropics. The CARBONO project was designed to make it possible to assess the effects of annual and sub-annual climatic variation on forest productivity and dynamics over the long term.
Clark, Clark, Oberbauer, and other collaborators developed the first grants for the CARBONO Project. Initial support came from NSF, DOE, the Andrew W. Mellon Foundation, and Conservation International’s TEAM Initiative. Subsequent funding has been provided from other programs within NSF and NASA. Today (2012) the core measurements are being supported by a 5-yr grant from NSF’s LTREB program to David B. Clark and Deborah A. Clark with additional funding from NASA to D.B. Clark. Steven Oberbauer leads a parallel NSF-funded research program at La Selva, monitoring forest atmosphere exchanges of CO2, water and energy using eddy flux methods.
——————————–0——————————–
Design
The CARBONO project is based on field measurements carried out across the project’s network of 18 half-hectare plots. The half-hectare plot size was selected based on both the spatial scale of significance within landscape variation in the forest basal area and the grain size of the different habitats of interest, particularly steep slopes. Three edaphic categories were identified as capturing the important axes of upland (non-swamp) landscape structure: (1) moderately fertile flat sites on old alluvium (the youngest oxisols at La Selva), (2) relatively infertile flat sites on ridge tops, and (3) relatively infertile steep slopes. Plot locations were selected using the La Selva geographic information system (GIS) to produce a stratified random design to sample the three edaphic categories. We used random numbers to select plot coordinates within the GIS coverages of soil types and slope. Potential plot locations that crossed streams, main trails, or protected areas were omitted. Plot selection was therefore stratified random within edaphic categories. An important feature of the plot-network design was that the researchers had no knowledge of forest structure at a selected plot location. As a result, the network provides a representative, objective assay of the entire landscape. Plots were surveyed with a tripod-mounted surveying compass and were based on slope-corrected distances (subsequently verified by GPS-location of the plot corners). In each plot, permanent monuments were installed at 10-m spacing.
The soils of the CARBONO plots were sampled and characterized chemically in 1998 (total C, N, P, cations, Fe, Mn, Al, pH) by E. Veldkamp, J. Mackensen, and D. B. Clark (data published in Appendix L, Espeleta & Clark. 2007. Ecological Monographs). Bulked samples from six cores per depth (0–10 cm, 10–30 cm, 30–50 cm, 50–100 cm), regularly spaced across each plot, were taken in each Old Alluvial terrace and Residual Soil plateau plot; bulked samples from six cores per depth, regularly spaced across upper, middle and lower slope positions, were taken from each Residual Soil slope plot. We calculated soil element stocks for each depth by multiplying element concentrations by soil bulk density. Bulk density was determined (Veldkamp et al. 2003) for the two soil types as mean values from each depth in pits adjacent to three plots on each soil (Old Alluvial terrace and Residual Soil plateau; for the Residual Soil slope plots we used Residual Soil plateau bulk density values). The plot network spans an approximately two- to threefold range in total soil stocks of phosphorus (P), potassium (K), and calcium (Ca)..
——————————–0——————————–
Project Staff
- Deborah A. Clark, Principal Investigator
Contact information:
Mailing Address: 1384 Lindenwood Grove, Colorado Springs, CO 80907 USA
Telephone: (719) 310-4168
E-mail: deborahanneclark @ gmail.com
Web page: http://www.umsl.edu/~biology/About%20the%20Department/Faculty/deborahclark.html
Profile: Deborah Clark is one of the original PIs of the CARBONO Project and has been studying the ecology of Costa Rican forests since 1980. Her current research in CARBONO focuses on forest biogeochemistry and productivity and how they are affected both by within-landscape edaphic heterogeneity and by interannual and long-term climatic/atmospheric change. She directs the CARBONO subprojects related to litterfall and inputs of coarse woody debris, participates in project database management, and annually updates the daily meteorological records based on qa/qc of the records from La Selva’s weather station. In 2010 she moved from La Selva to Colorado and now manages CARBONO Project activities through daily skype conferences and with regular visits to Costa Rica. When not doing tropical biology, she can be found hiking the backcountry of the Colorado Front Range with CO-PI David Clark.
CV: Deborah A. Clark´s CV
Photo: Deborah A. Clark´s Photo - David B. Clark, Principal Investigator
Contact information:
Mailing Address: 1384 Lindenwood Grove, Colorado Springs, CO 80907 USA
Telephone: (719) 310-4180
E-mail: dbclark50 @ yahoo.com
Web page: www.umsl.edu/~biology/faculty/davidclark.html
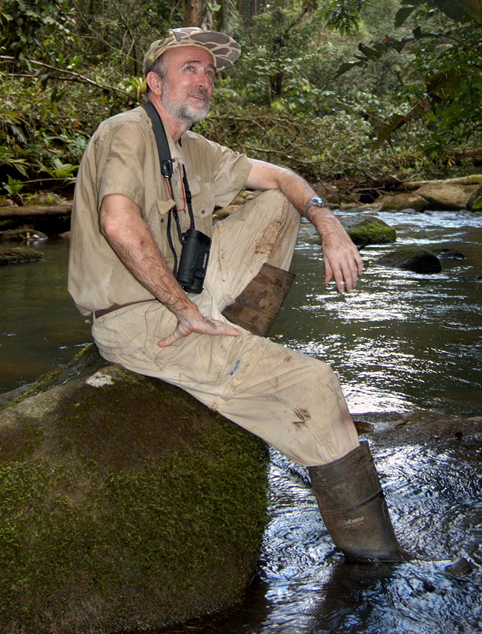
Profile: David Clark is one of the original PIs of the CARBONO Project and has been working in Costa Rican forests since 1980. His areas of research in CARBONO include tree demography, forest productivity and dynamics, the effects of global climate change on tropical forests, and the use of remotely-sensed data to scale results from plots to larger landscapes. In 2010 he moved from La Selva to Colorado, where he continues his research in CARBONO using daily video-calls to project staff combined with regular visits to Costa Rica. When not doing tropical biology, he can be found playing Celtic music on mandolin and fiddle or hiking the backcountry of the Colorado Mountains with his wife and CO-PI Deborah Clark.
CV: David B. Clark´s CV
Photo: David B. Clark´s Photo - James R. Kellner, Prinicipal Investigator
Photo: James R. Kellner’s Photo - Leonel Campos, Head Technician
Photo: Leonel Campos Photo 1 | Leonel Campos Photo 2 - William Miranda, Senior Technician
Photo: William Miranda Photo 1 | William Miranda Photo 2 - Mauricio (“Pini”) Cascante, Senior Technician
Photo: Mauricio Cascante Photo 1 | Mauricio Cascante Photo 2
——————————–0——————————–
Core annual-subannual measurements
From project inception in September 1997, the following core long-term field measurements have been continuously maintained in all 18 0.5-ha plots of the CARBONO Project plot network (the current funding extends through the 2013 census):
-
- Annual aboveground biomass (stocks, increment) and annual stem dynamics (recruitment, mortality), at the stand level and by tree-species & tree functional groupFrom 1997 onward, all live stems >10 cm diameter have been mapped and identified (all trees and palms to species, lianas treated as a group), as well as all stems 1-<10 cm diameter in a standard 10×10 m subplot per plot (since 2005). In the annual censuses (Sept.-Oct.) all stems are evaluated for survival, new stems recruiting to the minimum size are mapped and identified, and for all live stems the diameter is measured (nearest mm) at a permanently-marked point above buttresses or other irregularities.
-
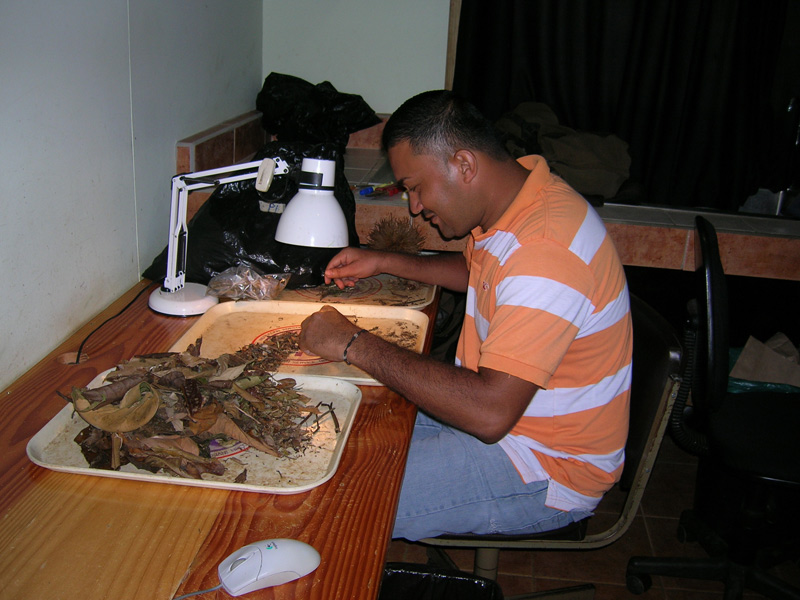
- Fine litterfallFine litterfall (leaf, wood < 1 cm diameter, reproductive material) has been collected biweekly in all plots since project inception. The litterfall is collected from nine pairs (1 standing basket + 1 ground trap for large [>50 cm]) leaves) of 0.25 m2 traps, sited in a standardized grid array across each plot. The litterfall is sorted by category and dried at 65oC to constant mass. The leaf-litter is then ground and incorporated into the longterm leaf-litter archive (maintained to enable subsequent chemical and isotope analysis).
-
- Coarse woody debris (CWD) (> 10-cm diameter: initial stocks, annual inputs) and 1-10 cm diameter wood-fall (monthly inputs)In annual censuses of all 18 CARBONO plots, all new pieces of fallen CWD > 30 cm in diameter are mapped, measured, and assessed for decomposition condition (Clark et al. 2002). In the annual CWD census, all new pieces of CWD 10-<30 cm dia. are also mapped, measured and assessed for condition in a standard 10×50 m subplot. The source of all CWD is noted (branch-fall or tree-fall, tree ID). The height and diameter of all standing-dead stems (> 10 cm dia.) are also measured. Intermediate-sized (1-<10 cm dia.) woody litterfall is collected monthly from the fine-litterfall ground-traps (see above) and dried at 65oC to constant mass.
-
- Soil moistureBeginning in April 1998, volumetric soil moisture has been assessed during all biweekly fine-litterfall collections with a permanent vertical FDR sensor measuring over the 0-30 cm depth layer of soil in the center of each of the 18 CARBONO plots.
-
- Canopy dynamics Annually, canopy heights in each plot are mapped based on measurements at the 231 points of a 5 x 5 m grid across the plot. Heights to 15 m are measured with a telescoping measuring pole, with verticality checked with a clinometer; sites higher than 15 m are classed as “high canopy.”
——————————–0——————————–
Results to Date
The high and sustained productivity of the project, approximately 100 publications to date, is evident in the list of publications. The project has amply fulfilled our original goal to serve as a research magnet for collaboration researchers. Over 100 researchers have co-authored papers related to data developed from the CARBONO Project.
The biggest scientific findings to date have centered on the tight coupling of forest performance to climate. Hotter nights and drier dry seasons both decrease wood production. The temperature and drought effects are statistically independent, a fact that only became detectable as the length of the data series increased. Because climate will surely warm and may well become drier in tropical rain forest areas, these are troubling results with global implications. Increasing atmospheric concentrations of CO2 have been hypothesized to be stimulating increased productivity in tropical rain forests. Our data-series, by far the longest to date from this biome, show that any stimulatory effects attributable to “CO2 fertilization” are trivial compared to the negative impacts already occurring from higher temperatures and from water-limitation.
Research findings from the first 12 years of the CARBONO Project have spanned five broad thematic areas:
-
- Forest structure (aboveground biomass and dynamics, CWD, LAI, plot floristics)
- Aboveground NPP(aboveground wood production/tree growth, litterfall)
- Stand-level physiology, leaf and bole respiration, VOCs
- Soil chemistry (soil nutrients & relation to litter invert.s, soil N processes), soil moisture, dry/wet deposition, throughfall
- Belowground C processes: C allocation, soil respiration, DOC, SOC stocks and dynamics, fine-root stocks and variation through time, mycorrhizae, microbes
- Remote sensing of forest structure and process (biomass, tree growth/mortality, gap dynamics)
D.A. Clark and D.B. Clark are forest ecologists. The research to date in other areas has proceeded in large measure by our seeking out scientists with additional expertise and offering to collaborate on interdisciplinary projects of mutual interest.
——————————–0——————————–
Current Status
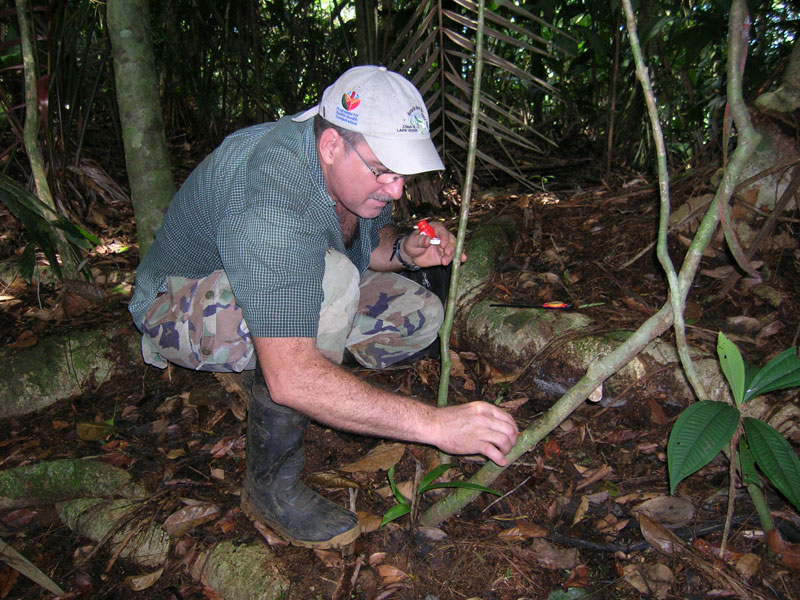
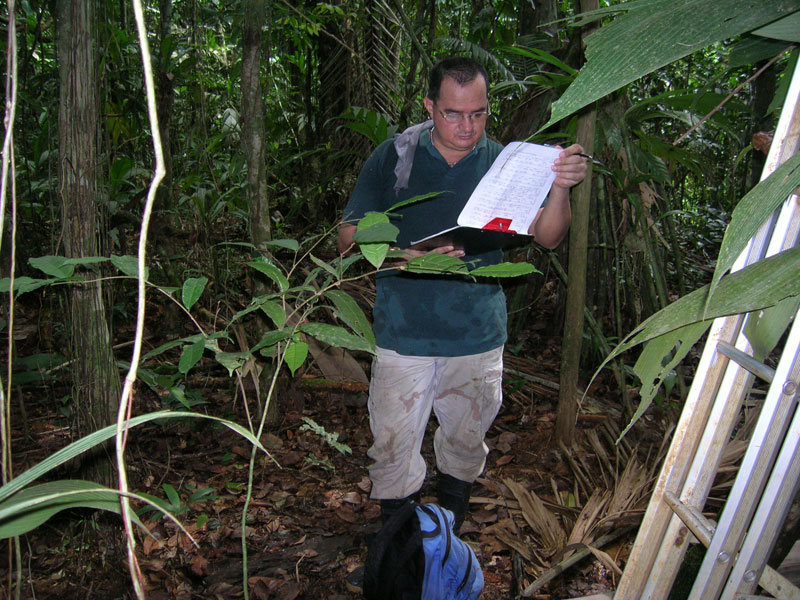
From 1980 – 2010 D.A. Clark and D.B. Clark lived on-site and managed the project through daily interactions with the three long-term Costa Rican field technicians participating in the project. In 2010 the Clarks moved to the United States. Since then the daily meetings with technicians have been conducted with Skype video calls. At the end of each field day the technicians scan the day’s field sheets and email them to the Clarks, who review them before the next day’s meeting at the start of the work day. In addition the Clarks make periodic trips to La Selva to continue technician training, update equipment inventories, and address any issues that can’t easily be worked on in video calls. The combination of daily contact supplemented by physical visits is working smoothly.
In 2014 Dr. James R. Kellner (Brown University) joined the Clarks as a Co-Principal Investigator on the current round of National Science Foundation Funding (NSF LTREB 1357177, 2014-2018). In 2016 the two half-time and one full-time forest technician positions were consolidated into two full-time positions. These two Costa Rican paraforesters (Leonel Campos and William Miranda) have been with the project since its inception, working in all phases of the research in both the field and laboratory.
With the annual census of 2017 we will complete the 21st consecutive annual census of the CARBONO plots. The CARBONO Project remains unique for the tropical-forest biome. At no other tropical-forest field site has forest performance been monitored over the long term at the landscape scale and at annual to sub-annual timesteps. The plots have served as a potent magnet to attract collaborating researchers, particularly those in remote sensing ecology. The field site’s location in the Republic of Costa Rica, which continues its traditional welcoming policy to foreign researchers, has been another key advantage of the project.
——————————–0——————————–
Photographs and Maps
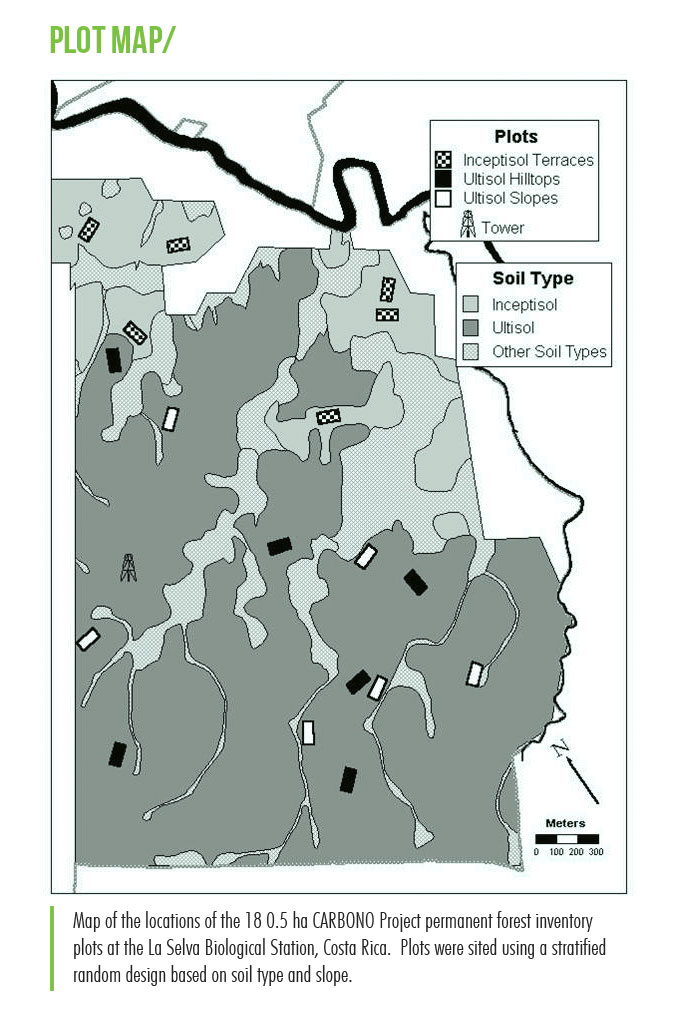 Map of the locations of the 18 0.5 ha CARBONO Project permanent forest inventory plots at the La Selva Biological Station, Costa Rica. Plots were sited using a stratified random design based on soil type and slope.
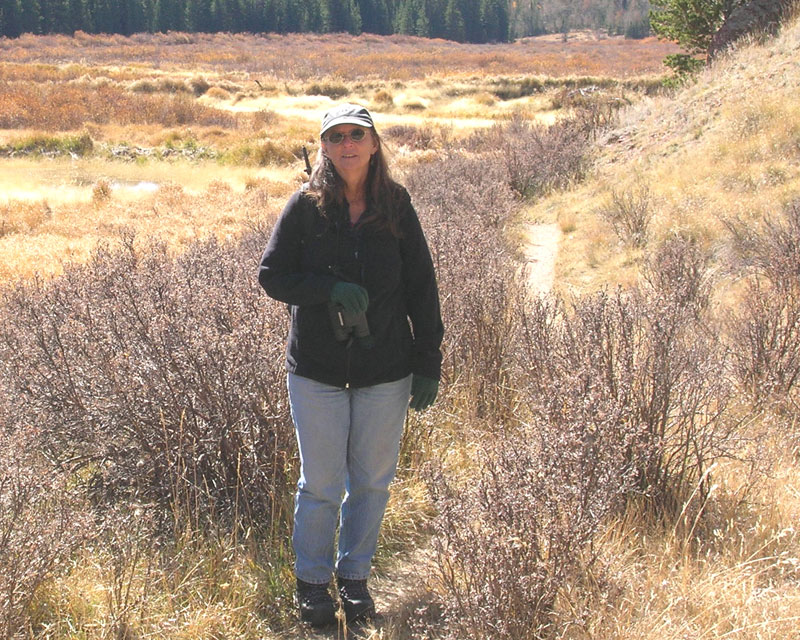
- Becker, A. 2000. Comparative study of soil carbon stocks and microbial biomass under old-growth forest and in old pasture, on two tropical soils. Master’s Thesis. U. Göttingen, Germany.
- Boehm, M. 2000. Landscape-scale variation in soil respiration in a tropical lowland rain forest. Master’s Thesis. U. Göttingen, Germany.
- Boyle, W.A., C.N. Ganong, D.B. Clark and M. Hast. 2008. Density, distribution, and attributes of tree cavities in an old-growth tropical rain forest. Biotropica 40:241-245.
- Cavaleri, M.A. 2007 Ecosystem respiration and foliar morphology of a primary tropical rain forest: The effects of canopy structure and environmental gradients. Doctoral dissertation, Colorado State University, 132 pp.
- Cavaleri, M.A., M.G. Ryan, and S. F. Oberbauer. 2006. Wood CO2 efflux in a primary tropical rain forest. Global Change Biology 12:2442-2458.
- Cavaleri, M.A., S.F. Oberbauer, D.B. Clark, D.A. Clark, and M.G. Ryan. 2010. Height is more important than light in determining leaf morphology in a tropical forest. Ecology 91:1730-1739.
- Cavaleri,M.A., Oberbauer,S.F. & Ryan,M.G. 2008. Foliar and ecosystem respiration in an old-growth tropical rain forest. Plant, Cell and Environment 31: 473-483.
- Chapin, F.S. III, G.M Woodwell, J.T. Randerson, G.M. Lovett, E.B. Rastetter, D.D. Baldocchi, D.A. Clark, M.E. Harmon, D.S. Schimel, R. Valentini, C. Wirth, J.D. Aber, J.J. Cole, A. Giblin, M.L. Goulden, J.W. Harden, M. Heimann, R.W. Howarth, P.A. Matson, A.D. McGuire, J.M. Melillo, H.A. Mooney, J.C. Neff, R.A. Houghton, M.L. Pace, M.G. Ryan, S.W. Running, O.E. Sala, W.H. Schlesinger, & E.-D. Schulze. 2006. Reconciling carbon-cycle concepts, terminology, and methodology. Ecosystems 9:1041-1050.
- Chazdon. R.L., A. Chao, R.K. Colwell, S-Y. Lin, N. Norden, S.G. Letcher, D.B. Clark, B. Finegan, and J.P. Arroyo. 2011. A novel statistical method for classifying habitat generalists and specialists. Ecology 92:1332–1343.
- Clark DB, Ferraz A, Clark DA, Kellner JR, Letcher SG, Saatchi S (2019) Diversity, distribution and dynamics of large trees across an old-growth lowland tropical rain forest landscape.
- Clark, D.A. 2002. Are tropical forests an important carbon sink?: reanalysis of the long-term plot data. Ecological Applications 12:3-7.
- Clark, D.A. 2004. Sources or sinks?: the responses of tropical forests to current and future climate and atmospheric composition. Philosophical Transactions of the Royal Society of London, Series B 359:477-491.
- Clark, D.A. 2004. Tropical forests & global warming: are they slowing it down?… or speeding it up? Frontiers in Ecology and the Environment 2:73-80.
- Clark, D.A. 2007. Detecting tropical forests’ responses to global climatic and atmospheric change: current challenges and a way forward. Biotropica 39 (1): 4-19.
- Clark, D.A. and D.B. Clark. 2010. Assessing tropical forests’ climatic sensitivities with long-term data. Biotropica 43:31-40. (doi:10.1111/j.1744-7429.2010.00654.x).
- Clark, D.A., Brown, S., Kicklighter, D.W., Chambers, J.Q., Thomlinson, J.R., Ni, J. and Holland, E.A. 2001. Net primary production in tropical forests: an evaluation and synthesis and existing fiel data. Ecological Applications 11(2): 371–384.
- Clark, D.A., D.B. Clark & S.F. Oberbauer. 2013. Field-quantified responses of tropical rainforest aboveground productivity to increasing CO2 and climatic stress, 1997-2009. Journal of Biogeosciences 118:1–12, doi:10.1002/jgrg.20067
- Clark, D.A., S. Brown, D. Kicklighter, J. Chambers, J.R. Thomlinson, and Jian Ni. 2001. Measuring net primary production in forests: concepts and field methods. Ecological Applications 11:356-370.
- Clark, D.A., S. Brown, D. Kicklighter, J. Chambers, J.R. Thomlinson, Jian Ni, and E.A. Holland. 2001. NPP in tropical forests: an evaluation and synthesis of existing field data. Ecological Applications 11: 371-384.
- Clark, D.A., S. Brown, D. Kicklighter, J. Chambers, J.R. Thomlinson, Jian Ni, and E.A. Holland. 2001. Appendix 1. Estimates from the literature of net primary productivity in tropical forests. Ecological Archives A011-006.
- Clark, D.A., S.C. Piper, C.D. Keeling, and D.B. Clark. 2003. Tropical rain forest tree growth and atmospheric carbon dynamics linked to interannual temperature variation during 1984-2000. PNAS 100(10):5852-5857.
- Clark, D.B, J.M. Read, M.L. Clark, A. Murillo Cruz, M. Fallas Dotti & D.A. Clark. 2004. Application of 1-m and 4-m resolution satellite data to studies of tree demography, stand structure and land use classification in tropical rain forest landscapes. Ecological Applications14:61-74.
- Clark, D.B. 2002. Los factores edáficos y la distribución de las plantas. Pp. 193-221 in M. Guariguata and G. Kattan, eds., Ecología y Conservación de Bosques Neotropicales, Libro Universitario Regional, Cartago, Costa Rica.
- Clark, D.B. and J.R. Kellner. 2012. Tropical forest biomass estimation and the fallacy of misplaced concreteness. Journal of Vegetation Science doi: 10.1111/j.1654-1103.2012.01471.x
- Clark, D.B., and D.A. Clark. 2000. Landscape-scale variation in forest structure and biomass in a tropical rain forest. Forest Ecology and Management 137:185-198.
- Clark, D.B., C. Soto Castro, L.D. Alfaro Alvarado, J.M. Read. 2004. Quantifying mortality of tropical rain forest trees using high-spatial-resolution satellite data. Ecology Letters 7:52-59.
- Clark, D.B., D.A. Clark and S.F. Oberbauer. 2010. Annual wood production in a tropical rain forest in NE Costa Rica linked to climatic variation but not to increasing CO2. Global Change Biology 16:747-759. doi: 10.1111/j.1365-2486.2009.02004.x.
- Clark, D.B., D.A. Clark, S. Brown, S.F. Oberbauer, and E.Veldkamp. 2002. Stocks and flows of coarse woody debris across a tropical rain forest nutrient and topography gradient. Forest Ecology and Management 164:237-248.
- Clark, D.B., P. C. Olivas, S. F. Oberbauer, D.A. Clark, and M.G. Ryan. 2008. First direct landscape-scale measurement of tropical rain forest Leaf Area Index, a key driver of global primary productivity. Ecology Letters 11:163-172. (Selected paper, Faculty of 1000 Biology)
- Clark, M.L, Roberts, D.A., Clark, D.B. and J.J. Ewel. 2011. Estimation of tropical rain forest aboveground biomass with small-footprint lidar and hyperspectral sensors. Remote Sensing of Environment 115:2931–2942. doi:10.1016/j.rse.2010.08.029
- Clark, M.L., D.B. Clark, and D.A. Roberts. 2004. Small-footprint lidar estimation of sub-canopy elevation and tree height in a tropical rain forest landscape. Remote Sensing of Environment 91: 68–89
- Davidson, E.A., K. Savage, P. Bolstad, D.A. Clark, P.S. Curtis, D.S. Ellsworth, P.J. Hanson, B.E. Law, Y. Luo, K.S. Pregitzer, J.C. Randolph, and D.Zak. 2002. Belowground carbon allocation in forests estimated from litterfall and IRGA-based soil respiration measurements. Agricultural and Forest Meteorology 113: 39-51.
- DeWalt, S. J., S. A. Schnitzer, J. Chave, F. Bongers, R. J. Burnham, Z. Q. Cai, G. Chuyong, D. B. Clark, C. E. N. Ewango, J. J. Gerwing, E. Gortaire, T. Hart, G. Ibarra-Manríquez, K. Ickes, D. Kenfack, M. J. Macía, J.-R. Makana, J. Mascaro, M. Martínez-Ramos, S. Moses, H. C. Muller-Landau, M. P. E. Parren, N. Parthasarathy, D. R. Pérez-Salicrup, F. E. Putz, H. Romero-Saltos, and D. Thomas. 2010. Annual rainfall and seasonality predict pan-tropical patterns of liana density and basal area. Biotropica 42:309-317.
- Drake, J.B. 2001. Estimation of tropical forest aboveground biomass using large-footprint lidar. Ph.D. Thesis. University of Maryland, College Park, Maryland, USA.
- Drake, J.B., R. Dubayah, R. Knox, D. B. Clark, and J. B. Blair. 2002. Sensitivity of large-footprint lidar to canopy structure and biomass in a neotropical rainforest. Remote Sensing of Environment 81:378-392.
- Drake, J.B., R.G. Knox, R.O. Dubayah, D.B. Clark, and R. Condit. 2003. Above-ground biomass estimation in closed-canopy Neotropical forests using lidar remote sensing: factors affecting the generality of relationships. Global Ecology and Biogeography 12:147-159.
- Drake, J.B., R.O. Dubayah, D.B. Clark, R.G. Knox, J.B. Blair, M.A. Hofton, R.L. Chazdon, J.F. Weishampel, and S.D. Prince. 2002. Estimation of tropical forest structural characteristics using large-footprint lidar. Remote Sensing of Environment 79:305-319.
- Dubayah, R.O., S. L. Sheldon, D. B. Clark, M. A. Hofton, J. B. Blair, G. C. Hurtt, and R. L. Chazdon. 2010. Estimation of tropical forest height and biomass dynamics using lidar remote sensing at La Selva, Costa Rica. Journal of Geophysical Research-Biogeosciences. 115:G00E09-doi:10.1029/2009JG000933.
- Eaton, W.D, S. McDonald, M. Roed, K.L. Vandecar, J.B. Hauge,and D. Barry. 2011. A comparison of nutrient dynamics and microbial community characteristics across seasons and soil types in two different old growth forests in Costa Rica. 2011. Tropical Ecology 52:35-48.
- Englund, S.R., J.J. O’Brien and D.B. Clark. 2000. Evaluation of digital and film hemispherical photography and spherical densiometry for measuring forest light environments. Canadian Journal of Forest Research 30:1999-2005.
- Espeleta, J.F. and D.A. Clark. 2007. Multi-scale variation in fine-root biomass in a tropical rain forest: a 7-yr study. Ecological Monographs 77:377-404.
- Fichtler, E., D.A. Clark, and M. Worbes. 2003. Age and long-term growth of trees in an old-growth tropical rain forest, based on analyses of tree rings and 14C. Biotropica 35(3):306-317.
- Frolking, S., M.W. Palace, D.B. Clark, J.Q. Chambers, H.H. Shugart and G.C. Hurtt. 2009. Forest disturbance and recovery – a general review in the context of space- borne remote sensing of impacts on aboveground biomass and canopy structure. Journal of Geophysical Research – Biogeosciences 114, G00E02, doi:10.1029/2008JG000911.
- Geron, C., A. Guenther, J. Greenberg, H.W. Loescher, B. Baker, and D.A. Clark. 2002. Biogenic volatile organic compound emissions from a rain forest in Costa Rica. Atmospheric Environment 36(23): 3793-3802.
- Heincke, M. 1999. Spatial and temporal variation in dissolved organic nitrogen (DON) down the soil profile, in a tropical lowland rain forest. Master’s Thesis. U. Hohenheim, Germany.
- Houghton, R. and S. Goetz. 2008. New satellites help quantify carbon sources and sinks. EOS, Transactions 89:417-418.
- Huang,C.-Y., K.L. Tully, D.A. Clark, S.F. Oberbauer and T.P. McGlynn. 2012. The δ15N signature of the detrital food web tracks a landscape-scale soil phosphorus gradient in a Costa Rican lowland tropical rainforest. Journal of Tropical Ecology 28:395-403.
- Hurtt, G. C., R. Dubayah, J. Drake, P. R. Moorcroft, S. W. Pacala, J. B. Blair, and M. G. Fearon. 2004. Beyond potential vegetation: combining LIDAR data and a height-structured model for carbon studies. Ecological Applications 14:873-883.
- Karl,T., M. Potosnak, A. Guenther, D. Clark, J. Walker, J. D. Herrick, C. Geron. 2004. Exchange processes of volatile organic compounds above a tropical rain forest – implications for modeling tropospheric chemistry above dense vegetation. Journal of Geophysical Research, 109, D18306, doi:10.1029/2004JD004738.
- Kellner, J. R. 2008. Population and community dynamics of tropical rain forest canopy trees. Doctoral Dissertation. Department of Plant Biology, The University of Georgia.
- Kellner, J.R., D.B. Clark and M.A. Hofton. 2009. Canopy height and ground elevation in a mixed land use lowland Neotropical rain forest landscape. Ecology 90:3274 and Ecological Archives E090-233
www.esapubs.org - Kellner, J.R., D.B. Clark and S.P. Hubbell. 2009. Pervasive canopy dynamics produce short-term stability in a tropical rain forest landscape. Ecology Letters 12: 155–164.
- Kleber, M., L. Schwendenmann, E. Veldkamp, J. Rössner, and R. Jahn. 2007. Halloysite versus gibbsite: Silicon cycling as a pedogenetic process in two lowland neotropical rain forest soils of La Selva, Costa Rica. Geoderma 138: 1-11.
- Litton, C.M., J.W. Raich, and M.G. Ryan. 2007. Carbon allocation in forest ecosystems. Global Change Biology 13: 2089-2109.
- Loescher, H.W., Bentz, S.F. Oberbauer, Ghosh, Tompson, Loyalka. 2004. Characterization and dry deposition of carbonaceous aerosols in a wet tropical forest canopy. Journal of Geophysical Research 109, D02309, doi:10.1029/2002JD003353.
- Loescher, H.W., H.L. Gholz, J.M. Jacobs, and S.F. Oberbauer. 2005. Energy dynamics and modeled evapotranspiration from a wet tropical forest in Costa Rica. Journal of Hydrology 315: 274-294.
- Loescher, H.W., S.F. Oberbauer, H.L. Gholz and D.B. Clark. 2003. Environmental controls on net ecosystem-level carbon exchange and productivity in a Central American tropical wet forest. Global Change Biology 9:396-412.
- Loescher, H.W., S.F. Oberbauer, J.S. Powers, and A.J. Hiremath. 2002. Spatial variation of throughfall volume in an old-growth tropical wet forest, Costa Rica. Journal of Tropical Ecology 18:397-407.
- Lovelock CE, SR Wright, KA Nichols. 2004. Using glomalin as an indicator for arbuscular mycorrhizal hyphal growth: an example from a tropical rain forest soil. Soil Biology and Biochemistry 36: 1009-1012.
- Lovelock, C.E., S. Wright, D.A. Clark, and R.W. Ruess. 2004. Soil stocks of glomalin produced by arbuscular mycorrhizal fungi across a tropical rain forest landscape. Journal of Ecology 92: 278-287.
- Martin,M.E., Plourde,L.C., Ollinger,S.V., Smith,M.-L. & McNeil,B.E. 2008. A generalizable method for remote sensing of canopy nitrogen across a wide range of forest ecosystems. Remote Sensing of Environment, 112:3511-3519, doi:10.1016/ j.rse.2008.04.008.
- McGlynn, T.P. 2010. Polygyny in thief ants responds to competition and nest limitation but not food resources. Insectes Sociaux 57: 23-28.
- McGlynn, T.P., H.K.Choi, S.T. Mattingly, A. Upshaw, E.K. Poirson, and J. Betzelberger. 2009. Spurious and functional correlates of the isotopic composition of a generalist across a tropical rainforest landscape. BMC Ecology 9:23 (doi:10.1186/1472-6785-9-23).
- McGlynn, T.P., R.M. Fawcett, and D.A. Clark. 2009. Litter biomass and nutrient determinants of ant density, nest size and growth in a Costa Rican tropical wet forest. Biotropica 41(2):234-240.
- McGlynn,T.P., R.R. Dunn, D.J. Salinas, T.E. Wood, D. Lawrence, and D.A. Clark. 2007. Phosphorus limits tropical rain forest litter fauna. Biotropica 39:50-53.
- McGlynn,T.P., S.E. Diamond, and R.R. Dunn. 2012. Tradeoffs in the evolution of caste and body size in the hyperdiverse ant genus Pheidole. PLOS One 10: e48202.
- McPherson, T. Y. 2006. Tree species performance in a tropical forest: the role of soil nutrients and topography. MS Thesis. University of Connecticut, Storrs, Connecticut, USA.
- Morehead, S.A. 2001. Geographic variation in host location cues for a dipteran parasitoid of Paraponera clavata. Biotropica 33(3): 495-501.
- Muller-Landau, H. C. 2004. Interspecific and inter-site variation in wood specific gravity of tropical trees. Biotropica 36: 20-32.
- Murillo Cruz, A., and M. Fallas Dotti. 2001. Georectificación de alta precisión de imágenes del satélite IKONOS y su aplicación a estudios de ecología forestal en la Estación Biológica La Selva. Undergraduate Thesis, School of Forestry, Universidad Nacional de Costa Rica.
- O’Brien, J.J., S. F. Oberbauer, D. B. Clark, and D. A. Clark. 2008. Phenology and stem diameter increment seasonality in a Costa Rican wet tropical forest. Biotropica 40:151-159.
- Oberbauer, S.F., H. Loescher, and D. B. Clark. 2000. Effects of climate factors on daytime carbon exchange from an old-growth forest in Costa Rica. Selbyana 21:66-73 (Proceedings of the Second International Forest Canopies Conference—Forest Canopies 1998: Global Perspectives (Part IV))
- O’Brien J.J., and S.F. Oberbauer. 2001. An inexpensive portable meter to read soil moisture probes. Soil Science Society of America Journal. 65:1081-1083
- O’Brien, J. J. 2001. The effects of climate on the growth and physiology of tropical rain forest canopy trees. Ph.D. Dissertation. Florida International University, Miami FL.
- O’Brien, J.J., S.F. Oberbauer, and D.B. Clark. 2004. Whole tree xylem sap flow responses to multiple environmental variables in a wet tropical forest. Plant, Cell, and Environment 27: 551–567.
- Olivas, P.C., S.F. Oberbauer, D.B. Clark, D.A. Clark, M.G. Ryan, J.J. O’Brien and H. Ordoñez. 2013. Comparison of direct and indirect methods for assessing leaf area index across a tropical rain forest landscape. Agricultural and Forest Meteorology. 177, 110-116 (noted on journal website as dated 15 Aug. 2013)
- Palmer, M.W., D.B. Clark, and D.A. Clark. 2000. Is the number of tree species in small tropical forest plots nonrandom? Community Ecology 1:95-101.
- Peterson, B.E. 2000. Recovery of forest canopy heights using large-footprint lidar. Master’s Thesis. Department of Geography. University of Maryland, College Park. 58 pp.
- Porder, S., D.A. Clark, and P.M. Vitousek. 2006. Persistence of rock-derived nutrients in the wet tropical forests of La Selva. Ecology 87(3): 594-602.
- Posada, J.M. and E. A. G. Schuur. 2011. Relationships among precipitation regime, nutrient availability, and carbon turnover in tropical rain forests. Oecologia 165 (DOI 10.1007/s00442-010-1881-0):783-795. [used CARBONO data for % legumes in L4, but didn’t acknowledge the grant per se – did acknowledge the project, though]
- Raich, J. W., D. A. Clark, L. Schwendenmann, and T. E. Wood. 2014. Aboveground tree growth varies with belowground carbon allocation in a tropical rainforest environment, PLoS ONE, 9, e100275.doi:10.1371/journal.pone.0100275.
- Saatchi, S., Marlier, M., Chazdon, R.L., Clark, D.B. and A.E. Russell. 2011. Impact of spatial variability of tropical forest structure on radar estimation of aboveground biomass. Remote Sensing of Environment 115 (11) 2836-2849.
- Sanchez Bragado, R. 2010. Leaching of dissolved organic carbon and other solutes from coarse woody debris in a tropical rainforest, Costa Rica. Masters Thesis, U. Göttingen, Germany, 109pp.
- Schwendenmann L., E. Veldkamp, T. Brenes, J.J. O’Brien, J. Mackensen. 2003. Spatial and temporal variation in soil CO2 efflux in an old-growth neotropical rain forest, La Selva, Costa Rica. Biogeochemistry 64: 111-128.
- Schwendenmann, L. 2002. Below-ground carbon dynamics as a function of climate variability in undisturbed soils of a neotropical rain forest. Ph.D Dissertation. University of Goettingen. (Berichtsreihe des Forschungszentrums Waldökosysteme. Reihe A 184).
- Schwendenmann, L., and E. Veldkamp. 2005. The role of dissolved organic carbon, dissolved organic nitrogen and dissolved inorganic nitrogen in a tropical wet forest. Ecosystems. 8: 339–351. DOI: 10.1007/s10021-003-0088-1
- Schwendenmann, L., and E. Veldkamp. 2006. Long-term CO2 production from deeply weathered soils of a tropical rain forest: evidence for a potential positive feedback to climate warming. Global Change Biology 12: 1-16.
- Silva, C., J. Kellner, D.B. Clark, and D.A. Clark. 2013. Response of an old-growth tropical rainforest to transient high temperature and drought. Global Change Biology, 19, 3423-3434. DOI: 10.1111/gcb.12312
- Silver W. L., A. W.Thompson, A. Reich, J. J Ewel, and M. K. Firestone. 2005. Nitrogen cycling in tropical plantation forests: potential controls on nitrogen retention. Ecological Applications15: 1604-1614.
- Slik,J.W. F., et al. (193 co-authors including D.A. Clark and D.B. Clark). 2015. An estimate of the number of tropical tree species Proceedings of the U.S. National Academy of Science 112: 7472-7477.
- Solano Valverde, V. 2000. Estudio de la diversidad, abundancia y distribuciónde palmas en bosques primarios y secundarios de la región Huétar Norte, Sarapiquí. Undergraduate Thesis, Universidad Nacional, Costa Rica.
- Thomas, R.Q., J.R. Kellner, D.B. Clark and D.R. Peart. 2013. Low mortality in tall tropical trees. Ecology 94:920-929, http://dx.doi.org/10.1890/12-0939.1 .
- Truong-Lol,M.-L., S. Saatchi, and S. Jaruwatanadilok. 2014. Soil moisture estimation under tropical forests using UHF radar polarimetry. Geoscience and Remote Sensing, IEEE Transactions on 53: 1718-1727, DOI:10.1109/TGRS.2014.2346656.
- Tully,K.L., Wood,T.E., Schwantes,A.M. & Lawrence,D. 2013. Soil nutrient availability and reproductive effort drive patterns in nutrient resorption in Pentaclethra macroloba. Ecology 94, 930-940, http://dx.doi.org/10.1890/12-0781.1.
- Vandecar, K. May, 2010. Temporal and spatial patterns of soil nutrient availability in a wet tropical forest, Costa Rica. Doctoral Thesis, University of Virginia.
- Vandecar, K.L., D. Lawrence, & D. A. Clark. 2011. Phosphorus sorption dynamics of anion exchange resin membranes in tropical rainforest soils. Soil Science Society of America Journal 75 (4): 1520-1529. (doi:10.2136/sssaj2010.0390).
- Vandecar, K.L., D. Lawrence, T. Wood, S.F. Oberbauer, R. Das, K. Tully, and L. Schwendenmann. 2009. Biotic and abiotic controls on diurnal fluctuations in labile soil phosphorus of a wet tropical forest. Ecology 90: 2547-2555.
- Veldkamp, E. and J.J. O’Brien. 2000. Calibration of a frequency domain reflectrometry sensor for humid tropical soils of volcanic origin. Soil Science Society of America Journal 64: 1549-1553.
- Veldkamp, E., A. Becker, L. Schwendenmann, D.A. Clark, and H. Schulte-Bisping. 2003. Substantial labile carbon stocks and microbial activity in deeply weathered soils below a tropical wet forest. Global Change Biology 9: 1171-1184.
- Wagner, F. H., B. Herault, D. Bonal, C. Stahl, L. O. Anderson, T. R. Baker, G. S. Becker, H. Beeckman, D. B. Souza, P. C. Botosso, D. M. J. S. Bowman, A. Brauning, B. Brede, F. I. Brown, J. J. Camarero, P. B. Camargo, F. C. G. Cardoso, F. A. Carvalho, W. Castro, R. K. Chagas, J. Chave, E. N. Chidumayo, D. A. Clark, and 80 more authors, Climate seasonality limits leaf carbon assimilation and wood productivity in tropical forests., Biogeosciences, Feb. 2016.
- Woldemariam, Ghebray Tesfay. 2006. Respiration measurement from coarse woody debris in a tropical rainforest ecosystem. A case study from La Selva Biological Station, Costa Rica. Master’s Thesis, University of Göttingen, Germany.
- Wood, T. E. 2003. Leaf litter nutrient cycling in a mature wet tropical forest in Costa Rica. Master’s Thesis, University of Virginia, 53 pp.
- Wood, T.E. 2006. Seasonality and foliar nutrient dynamics of a wet tropical forest in Costa Rica. Doctoral dissertation. University of Virginia (USA), 145 pp.
- Wood, T.E., and D. Lawrence. 2008. No short-term change in soil properties following four-fold litter addition in a Costa Rican rain forest. Plant and Soil 307:113-122.
- Wood, T.E.; Lawrence, D.A.; Clark, D.A. 2005. Variation in leaf litter nutrients of a Costa Rican rain forest is related to precipitation. Biogeochemistry 73: 417-437.
- Wood,T., D. Lawrence, and D. A. Clark. 2006. Determinants of leaf litter nutrient cycling in a tropical rain forest: fertility versus topography. Ecosystems 9: 700-710.
- Wood,T.E., D. Lawrence, D.A. Clark, and R.L. Chazdon. 2009. Rain forest nutrient cycling and productivity in response to large-scale litter manipulation. Ecology 90(1): 109–121.
- Woods, C. L., C. L. Cardelus, and S. J. Dewalt. 2015. Microhabitat associations of vascular epiphytes in a wet tropical forest canopy. Journal of Ecology, 103, 421-430.
Data Use Policy
The Principal Investigators of the CARBONO Project (David B. Clark, Deborah A. Clark, James R. Kellner) are strongly committed to the principles and practice of free and open data access.
Data from the CARBONO project are posted on this website for free and unconditional use. There is no sign-in requirement to access the data, there are no conditions on data use for any non-commercial purpose including analysis and publication, and no records are kept of the identity of those downloading the data (we do track the number of data downloads).
The Principal Investigators are interested in knowing who is using the data and for what purposes. We would appreciate hearing from users of the data (to dbclark50 @ yahoo.com) on a variety of issues, including any errors or ambiguities in data or metadata, actual and potential uses for the data, and suggestions for improvements. We welcome offers to collaborate on publications arising from use of these data. In the case of publications that make substantive use of the data, we would appreciate acknowledgement of the institution supporting this research; for example, “Data from the CARBONO Project were developed with support from the United States National Science Foundation, most recently through NSF/LTREB 0841872 to D.B. Clark and D.A. Clark.” We emphasize that none of these requests should be construed as interfering with absolutely free and unconditional access to the data; these are requests, not conditions. The data can be downloaded completely freely with no reporting requirements or usage restrictions. It is our hope and a goal of this project that our open data use policy will foster the use of CARBONO data in a diverse suite of research efforts on tropical rain forest ecology.
——————————–0——————————–
Plot design and survey documentation
Metadata: LONG-TERM PLOT ESTABLISHMENT CRITERIA
- Task Code: 1001
- Investigator: David B. Clark
- Date (dd/mm/yy): Sept. ‘96 – Jan. ‘97
- Contact: David B. Clark
- Other researchers involved: Deborah A. Clark, and Leo Campos and William Miranda as surveyors.
- Key words: plot location, sample design, replication, soil type
- Response variables: Not applicable
- Soil Type: Inceptisols and Ultisols (all 18 0.5 ha CARBONO Plots)
- Study location: La Selva Biological Station, 10o26’N, 84o00’W, Costa Rica; all plots as mapped in the La Selva GIS. All are within Old La Selva, the unit bounded to the west by the Sarapiquí Annex and to the south by Braulio Carrillo National Park.
- Objectives: To design a series of forest inventory plots to study old growth forest at La Selva. We wanted to have an unbiased sample of three major geomorphic units within the old-growth area of Old La Selva: old alluvial terraces (then classified as inceptisols), flat ridgetops on poorer soils (then classified as ultisols), and steeply sloping sites on the same poor soils. We focused on Old La Selva because of the possibility of establishing long-term plots in areas with no known recent human disturbance history.
- Experimental design/methods: A base map for plot siting was prepared using a 5 m contour map of Old La Selva generated by the La Selva GIS system, overlaid with the streams and trails data layers, as well as the soils data layer for old-growth Old La Selva that is described in Clark, Clark and Read (1998 J. Ecol. 86:101-112.). The total old alluvial areas were outlined on the topo map. They fell into 4 blocks: CES/CEN, Sura Trail, beginning of CCL over to SHO, and back of CCL/beginning of CC. We apportioned the 6 plots among the 4 units to get the closet possible match of plot area/unit area. This was achieved by two plots in the first two units and one plot in each of the other two. A similar procedure was followed on the residual soils for the Matabuey and Jaguar series. Each of these soil series was divided into equal area blocks, as far as possible. The west Matabuey block was about twice the size of the east block, and we split it in the middle (grid E-W) on the topo map. The Jaguar unit was essentially contiguous, so we just split it (grid E-W) into 3 roughly equal area blocks. We apportioned 3 ridgetop and 3 slope plots to both the Matabuey and the Jaguar series.Within each of these areas, we used the following procedure for establishing a particular plot location. Within the unit, we looked for the first possible 50 x 100 m rectangular area which fit the topographic criteria, staying as close to the trails and to the station as possible. The operational criteria were: flat=no more than one 5 m contour line crossing the area, steep=>3 5 m contour lines crossing the plot. We used a model plot (to scale) as our criteria to evaluate these sites, working back from the closer to the farther areas as necessary. In the case of the 2 slope plots we aligned the long axis of the plot parallel to the contour lines of the slope. In all cases the first site that met the topographic criteria was accepted. The model was taped on the map, and its exact coordinates and bearing in the La Selva grid system were determined with a ruler and a compass from the map.With these coordinates in hand, we then went to the nearest La Selva grid point and surveyed in with a hand tape and compass to one of the plot corners. If the plot actually fit in that site, that became the site. Frequently however we had to move the plot 5-20 m to make it fit exactly on the topography (for example, to have the slope plots run from exactly from top of slope to base of slope, or to run exactly parallel to the contour lines). In these cases particular attention was paid to locating the plot only according to topography. We explicitly did not take forest structure into consideration. Some plots would not fit on the selected sites, because the GIS map topography differed from the real topography. A few sites were thus rejected on topographic grounds, and new sites were chosen following the procedures outlined above.In summary, the exact locations of these plots were determined by soil type and topography. Among equal sites, we chose ones closest to trails and the station. The design was purposefully blocked to achieve approximately equal sample intensity over the entire geomorphological unit. And very importantly, forest structure was explicitly NOT INCLUDED as a site defining variable. That is, the plots are located with no knowledge of or consideration of what the forest looked liked. We therefore believe these are unbiased samples of the forests growing in these different soil and topographic conditions.At each site we used a topographer’s transit to survey in the plots on a 10 x 10 grid. Most of the surveying was done by Leo Campos and William Miranda, after training by David Clark. All distances were slope corrected, and numerous lines were cross-surveyed to assess accuracy. Slope-corrected accuracies were < +50 cm/10 m. The original survey data are in a yellow field book, “Carbono #25”. Grid intersections are marked with 0.5 inch re-bar stakes (2 m tall), with a race-track shaped aluminum tag with the grid coordinates (first number = long axis grid line, 0 to 50, second equals short axis, 0 – 100).
- Data files: The original topo map with soil classifications for the grid points, from which the Clark, Clark and Read (1998) soils map was digitized is stored in one of the bottom plastic tubes of the map case in the GIS room. This also is the original map from which the plot locations were planned.
- Variables in data files: One copy of the base soils data file is c:\projects\vegmap\postedat.xls on DBC’s computer. This file was imported onto the GIS and is in several different data layers (compare to Figure 1 in Clark, Clark & Read). Documentation for development of the soils data layer can be found in Result #27 of the Clark, Clark and Read Results File (Pendi Results), or on DAC’s computer, c:\worddocs\soildefs.doc.
- Download as PDF format

- Plot establishment
Metadata: Slope determination protocols for Carbono plots:
- Task Code: 1005
- Investigator: David B. Clark
- Date (dd/mm/yy):28/02/97 – 28/04/97
- Contact: David B. Clark
- Other researchers involved: Technicians Danilo Villegas and Patricia Campos.
- Key words: topography, surveying, slope.
- Response variables: Angle of slope between all grid points in the 18 0.5 ha CARBONO plots.
- Soil Type: Ultisols and inceptisols (all CARBONO plots)
- Study location: La Selva Biological Station, 10o26’N, 84o00’W, Costa Rica; all plots as mapped in the La Selva GIS. All are within Old La Selva, the unit bounded to the west by the Sarapiquí Annex and to the south by Braulio Carrillo National Park.
- Objectives: To determine the angle of slope between all grid points, in order to make a topographic map of each plot.
- Experimental design/methods: A Suunto clinometer was used to site between two 1.5 m tall staffs, one at each of two different grid points. The angle, positive or negative, was recorded. Maps in the field book indicate the direction of measurement.
- Data files: The original data are in a yellow field book in the CARBONO office, CARBONO #3.
- Variables in data files: Slope measurements.csv, in comma-separated text.
- Download Slope Measurements
——————————–0——————————–
Soil nutrients
——————————–0——————————–
Annual plot inventory
Field data sheets
- 2015 Stems GTE 10 cm diameter
- 2015 Stems LT 10 cm diameter
- 2014 Stems GTE 10 cm diameter
- 2014 Stems LT 10 cm diameter
- 2013 Stems GTE 10 cm diameter
- 2013 Stems LT 10 cm diameter
- 2012 Stems GTE 10 cm diameter
- 2012 Stems LT 10 cm diameter
- 2011 Stems GTE 10 cm diameter
- 2011 Stems LT 10 cm diameter
- 2010 Stems GTE 10 cm diameter
- 2010 Stems LT 10 cm diameter
- 2009 Stems GTE 10 cm diameter
- 2009 Stems LT 10 cm diameter
- 2008 Stems GTE 10 cm diameter
- 2008 Stems LT 10 cm diameter
- 2007 Stems GTE 10 cm diameter
- 2007 Stems LT 10 cm diameter
- 2006 Stems GTE 10 cm diameter
- 2006 Stems LT 10 cm diameter
- 2005 Stems GE10 cm diameter
- 2005 Stems LT 10 cm diameter
- 2004 Stems GE 10 cm diameter
- 2003 Stems GE 10 cm diameter
- 2002 Stems GE 10 cm diameter
- 2001 Stems GE 10 cm diameter
- 2000 Stems GE 10 cm diameter
- 1999 Stems GE 10 cm diameter
- 1998 Stems GE 10 cm diameter
- 1997 Stems GE 10 cm diameter
Metadata
Data
- Stems LT 10 cm diameter
- Stems GTE 10 cm diameter
- CARBONO database file names and variable definitions & documentation for plot data through 2016
- Species list to 2016
- Individuals through 2016
- Plots table
- Size of each individual at every census through 2016
- Point of measurement changes through 2016
- Multiple-stemmed trees through 2016
- All annual individual’s growth through 2016
- Field notes through 2016
- Census dates all individuals through 2016
——————————–0——————————–
Biweekly litterfall
Metadata
Data
- Litterfall data Oct 11 – Sept 12
- Litterfall data Oct 10 – Sept 11
- Litterfall data Oct 09 – Sept 10
- Litterfall data Oct 08 – Sept 09
- Litterfall data Oct 07 – Sept 08
- Litterfall data Oct 06 – Sept 07
- Litterfall data Oct 05 – Sept 06
- Litterfall data Oct 04 – Sept 05
- Litterfall data Oct 03 – Sept 04
- Litterfall data Oct 02 – Sept 03
- Litterfall data Oct 01 – Sept 02
- Litterfall data Oct 00 – Sept 01
- Litterfall data Oct 99 – Sept 00
- Litterfall data Oct 98 – Sept 99
- Litterfall data Oct 97 – Sept 98
——————————–0——————————–
Annual coarse woody debris input
——————————–0——————————–
Biweekly Soil moisture
——————————–0——————————–
Annual canopy dynamics
Metadata: Protocolo para el censo 2012 de claros en las parcelas de CARBONO
(21 de mayo de 2012)
La meta de este censo es de mapear, en cada parcela, los sitios donde el dosel (la vegetación mas alta) tiene <=15 m de altura, y de documentar la altura de la vegetación menos alta de 15 m en cada uno de estos sitios (los cuales definimos como “claros”). Para esto, el procedimiento será de usar el tubón y el clinómetro para medir, sobre una cuadrícula de todos los puntos de 5 x 5 m, la vegetación mas alta (hasta 15 m) sobre cada punto.
Empezando con la esquina 0:0, se usan los binoculares y el clinómetro para identificar la vegetación (hoja o rama, de árbol, bejuco, o epífita) mas alta directamente sobre el tubo 0:0. Si parece que hay un hueco al cielo en la copa mas alta, directamente por encima del punto, se decide si el hueco tiene por lo menos 2 m x 2m de área – si sí, se busca el próximo nivel de vegetación (él que está directamente abajo) para medir. Si no (si el hueco parece mas pequeño que 2x2m), se evalúa la altura de esa copa mas alta. Si sobrepasa 1500 cm, se apunta como “1500”; si es exactamente de 1500 cm, se escribe “1499”. Si parece menos de 1500 cm (15m), una persona alza el tubón justo contra el tubo (o la estaca, en el caso de puntos sin tubo), y la otra persona dice cuando llegó al nivel de la vegetación mas alta, y se anota la altura en cm (p. ej., 10.43 m se anota como 1043 cm). Se en el punto no hay ninguna vegetación que llega mas alto que 150 cm, se apunta 150 cm.
OJO: Para cada claro (altura <=500 cm) se notará el factor que causó el claro en el campo para COMENTARIOS. Generalmente esto va a ser por caída de un tronco o de una rama. Se debe apuntar o el número del individual muerto o el número del árbol de donde cayó la rama. Si la causa es la caída de una rama noten el diámetro máximo de la rama.
Entre el tubo y el tubo vecino (0:10) se extiende en forma tensa y horizontal la cinta métrica. Se lee la distancia horizontal, y se va al punto exactamente en medio de los dos tubos (la distancia dividida por dos), y se coloca una estaca (provisional) verticalmente en este punto. NOTA: Si es imposible colocar la estaca exactamente donde debería estar, o por un árbol vivo, o por una tuca caída, se corre la estaca lo mínimo posible del sitio deseado, y se miden y se anotan la distancia del tubo y la orientación del tubo del punto donde realmente se ubicó la estaca. Una vez instalada la estaca, se mide la altura de la vegetación más alta sobre la estaca, y se apunta la altura.
Se vuelve al tubo 0:0, y se repite el proceso, para colocar una estaca a 5:0, o sea a la mitad entre los tubo 0:0 y 10:0. Y finalmente, se ubica una estaca a la mitad del diagonal entre tubo 0:0 y 10:10. Se miden las alturas sobre estas 2 estacas, y se remuevan.
Después se procede al tubo 0:10, y se mide la vegetación sobre el tubo, y así sucesivamente, completando bloques de 4 puntos (1 tubo + 3 estacas de enmedio), hasta llegar al tubo 0:100, donde se mide la vegetación sobre ese tubo, y sobre una estaca que se coloca a 5:100. De allí empiezan a volver por la línea 10:xx, haciéndo bloques de 4 tubos, etc.
Se marcan los puntos hechos, en el mapa de la parcela. Al hacer una “subparcela” de 4 tubos, se hace el punto “central” usando la cinta para hacer al diagonal, y poniendo una estaca exactamente en la mitad del diagonal. Y así sucesivamente, se miden las alturas de vegetación a cada 5 m por toda la parcela, incluyendo todas las filas de tubos en la parcela.
Como con todas las otras actividades en las parcelas, se toma mucho cuidado para no estorbar ni la vegetación ni el suelo. Se hacen las 18 parcelas en grupos de 3 (1A, 1L, 1P), para asegurar que siempre tengamos muestras iguales de las 3 clases de parcelas.
Se medirán las parcelas en el siguiente orden: L4, A4,P4; A5,L5,P5; A6,L6,P6; A1, L1, P1; A2,L2,P2; A3,L3,P3.
Cada año se medirán todos los puntos que se pueden en el primer dia como una medición de precisión. Se medirán los mismos puntos dejando por lo menos un día entre las dos mediciones. Estas mediciones se harán en la parcela L4, el máximo de las fajas 0:0-0:50 a 50:0-50:50 que se puede hacer en un día.
Los datos originales se escribirán en formularios de campo. Después estos se pasarán a archivos de Excel llamados Claros_XXX_original.xls y ClaroCal_XXX_original para los datos del censo y de la calibración respectivamente.
NOTA: Datos de serpientes grandes: se notarán observaciones cada vez que se ve un matabuey (Lechesis), terciopelo (Bothrops asper) o béquer (Boa). Esto incluye tanto los animales observados en el bosque como los que se ven a lo largo de los caminos.
Escriban los apuntes en el envés de los formularios con una observación apuntado una referencia permanente cercano, como un marcador de camino, un árbol marcado o un poste de la cuadrícula de La Selva o de las parcelas de CARBONO. Apunte la especie, la dirección lo más precisio posible, una descripción de lo que está haciendo el animal y su tamaño estimado, todo sin acercarse mucho y respetando el peligro potencial de estos animales.
Equipo:
- clinómetro – tubón – nivel
- cinta métrica de 25 m, listo para poder amarrar el extremo a un tubo
- 1-2 palos altos – brújula – 5 estacas (3 para usar, 2 en reserva)
- binoculares – mapa de los puntos en la parcela
- hojas de campo para los datos – cinta diamétrica
Data
Field Data Sheets
- 1999 canopy dynamics field data sheets
- 2000 canopy dynamics field data sheets
- 2001 canopy dynamics field data sheets
- 2002 canopy dynamics field data sheets
- 2003 canopy dynamics field data sheets
- 2004 canopy dynamics field data sheets
- 2005 canopy dynamics field data sheets
- 2006 canopy dynamics field data sheets
- 2007 canopy dynamics field data sheets
- 2008 canopy dynamics field data sheets
- 2009 canopy dynamics field data sheets
- 2010 canopy dynamics field data sheets
- 2011 canopy dynamics field data sheets
- 2012 canopy dynamics field data sheets
- 2013 canopy dynamics field data sheets
- 2014 canopy dynamics field data sheets
- 2015 canopy dynamics field data sheets
- 2016 canopy dynamics field data sheets
- 2017 canopy dynamics field data sheets
——————————–0——————————–
Climate data
Metadata
For analyses of the CARBONO data we use data from the weather station at the La Selva Biological Station: www.ots.ac.cr/meteoro. Because the annual plots census starts on 1 September and runs till early November, for many analyses we use average values for a 365 day interval from 1 October of one year till 30 September of the following year. We call this census-based interval “CARBONO years”. The primary source for all La Selva met data should be the La Selva met station. Here we post a 15-year subset of these data summarized by “CARBONO years”.
Data